Most honest traders will testify to the fact that losing their hard-won, open bitcoin gains is a painful, humbling experience. It’s even more of an emotional shakedown once they realize that many of those profit ‘give-backs’ were completely unnecessary.
The most successful traders know when it’s time to begin taking most (if not all) of their bitcoin gains before they’re siphoned away by a sudden market reversal. They employ a simple tactic known as ‘selling into strength’ and ‘covering into weakness.’
What Is ‘Selling into Strength?’
Per Investopedia.com’s definition of selling into strength:
“Selling into strength refers to the practice of selling out of a long or into a short position when the price of the asset is moving higher. The proactive strategy is designed to preempt an upcoming reversal in the price.”
Face it, no one can exactly time when bitcoin will peak (bottom) before reversing sharply lower (higher). Run quickly away from anyone who claims such powers of market divination.
However, sharp traders know how to put the power of statistics and probabilities to work, and this helps them avoid ‘overstaying’ a winning long or short bitcoin trade. You’re about to learn how to do this too.
Pie-In-The-Sky and The End of the World
You likely recall the fourth quarter of 2017 when bitcoin rallied to astronomical highs, virtually doubling within several months’ time. As prices smashed through every $1,000-denominated price level on the way up to twenty grand, both pro and amateur traders alike were caught up in the mania.
At the same time, a smaller number of bitcoin traders were eyeing the Keltner Channels on their charts, which were suggesting that scaling-out of profitable positions was a wise course of action.
Conversely, during November 2018’s bitcoin rout, the same traders saw that it was not the end of the line for bitcoin, and there was identifiable, logical exhaustion of the selling pressure. They would have wisely scaled out of big winning short trades when a particularly accurate Keltner Channel statistical support/resistance level was hit.
Keltner Channels to the Rescue
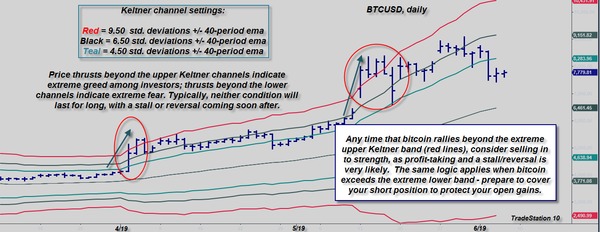
Here’s a simple, time-tested indicator template that can help you ID those times when the bitcoin market is surging to statistically improbable price zones that make further, sustained advances (declines) highly unlikely.

Any time you see bitcoin (or any altcoin) exceed an upper Keltner Channel level of 9.5 to 12 standard deviations beyond a 40-period ema, you should start to think about scaling out of profitable open trades. Generally, the bulk of the upthrust is complete on such a resistance zone break, at least on a near-term basis. (Chart graphic: TradeStation 10.)
Here a rational method for scaling out of a ‘Keltner Extreme’ long bitcoin trade:
- Take a third of your open gains on the first daily close beyond the extreme upper Keltner.
- On any subsequent thrust higher, sell another third.
- Finally, sell the remaining third as soon as bitcoin drops back inside the upper band.
Remember, the Keltner standard deviation and ema inputs shown on the chart can be adjusted to match your own bitcoin trading style. However, these numbers do appear to work well at identifying high probability overbought (oversold) price levels (and after nearly 40 years of technical chart-reading, this writer has yet to come across a better ‘time to book some gains’ technical indicator).
Using other technical and market sentiment analysis tools can help make the Keltners even more useful.
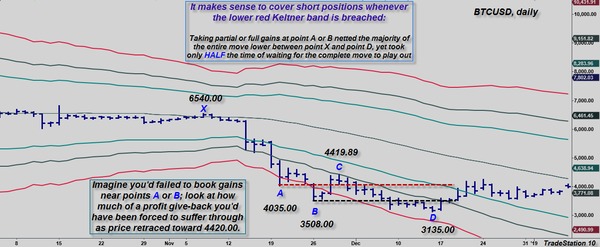
Let’s take a look a the extreme lower Keltner band at work in a major bitcoin downdraft.

November 2018’s bearish breakout was sudden and swift. Note the bullish bounces that occurred both times (points A and B) that bitcoin smashed below the extreme lower Keltner Channel. Had a trader covered half their short position at A and the other half at B, they would have made 75 percent of the gain of those who waited out the reversals, hoping for even lower prices (at point D). (Chart graphic: TradeStation 10.)
The above chart and caption pretty much say it all; taking gains on each punch below an extreme Keltner can be a very wise strategy.
Note that the traders who took gains at points A and/or B did not have to suffer through the temporary (yet significant) bullish pullbacks seen before the final, drawn-out descent to the final low at point D.
Even better, they made around 75 percent as much profit as the traders who hoped and waited for even lower prices.
Consider taking most, if not all, of your open gains each time an extreme lower Keltner Channel is breached. In doing so, you might even avoid those nasty ‘short squeezes’ that can make much of your gain disappear before you even realized what happened.
How to Make Money With Bitcoin Trading
Making money in the cryptocurrency markets is never easy!
However, if you trade a proven, statistically valid trading system, wisely limit your risk on each trade, and maintain rigid self-discipline, you may experience consistent success over the long haul.
An even bigger question for those who do manage to become successful bitcoin traders is this:
“How do I hang on to my bitcoin gains?”
The two Keltner Channel examples provided above might just help you answer that all-important question. Refer to this article every time you see bitcoin blast through the extreme upper or lower Keltners, applying your own profit-securement strategy.
Consider plotting the above template on your bitcoin and altcoin charts (it works well on virtually all time frame charts) and you’ll be one step ahead of foolhardy traders who are clueless as to impending trend exhaustion.
Doing so can help you walk away with more trading profits and a whole lot fewer regrets about the ‘big one that got away.’
For more bitcoin trading tips and strategies, subscribe to the Bitcoin Market Journal newsletter today!
Author disclosure:
The author does not have any open positions in bitcoin or any other coin at the time of this writing.
All trading examples and/or systems were constructed with the tools included standard in TradeStation 10. All trade examples and system results are hypothetical and are not specific trading/investing advice for any specific person or entity.

