What a way to start a morning, after bitcoin’s biggest slide since the coronavirus debut sell-off in mid-March. The FUD starts rolling in. …

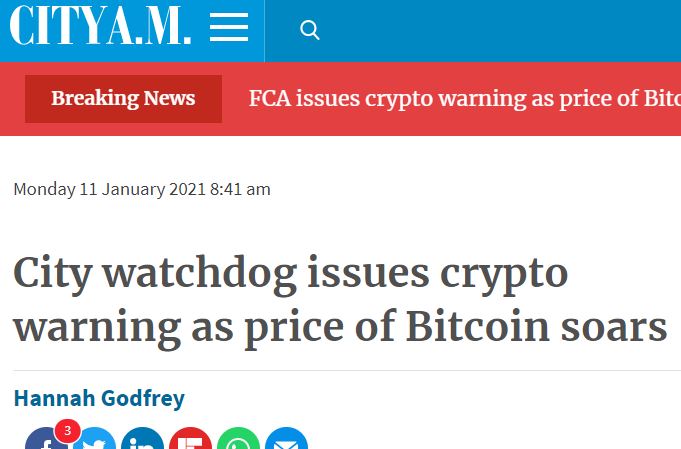
The timing here is simply impeccable, as it was released just as bitcoin has fallen more than 20% from the peak and ether took an even worse spill.
Looking more in-depth at the report, however, it quickly becomes clear that there isn’t anything new about their timely announcement. It’s just the same regurgitated warnings about volatility and risk that the U.K.’s lukewarm regulatory body has been spewing out for years.
They weren’t very thorough about it, either. For instance, they failed to mention regulatory risk, the exact kind that they are now creating for consumers with this report.
“Don’t invest more than you can afford to lose.” That’s the age old disclaimer. It’s at the bottom of this message, as well as anywhere else you find regulatory compliant market information. Only, for the purposes of this morning’s headlines, they changed it to “prepare to lose all your money.”
It kind of sounds similar, and an attorney may try to argue they mean the same thing, but you have to admit the tone just isn’t the same.
Correlated!
Additional FUD was provided by Scott Minerd, a fund manager who recently turned bullish but is now bearish, who less than a month ago said that bitcoin should be worth $400,000 and is currently awaiting U.S. Securities and Exchange Commission (SEC) approval to buy $500 million worth of the world’s most prominent digital currency, tweeted quite oddly that he’s ready to take profits at $35,000.
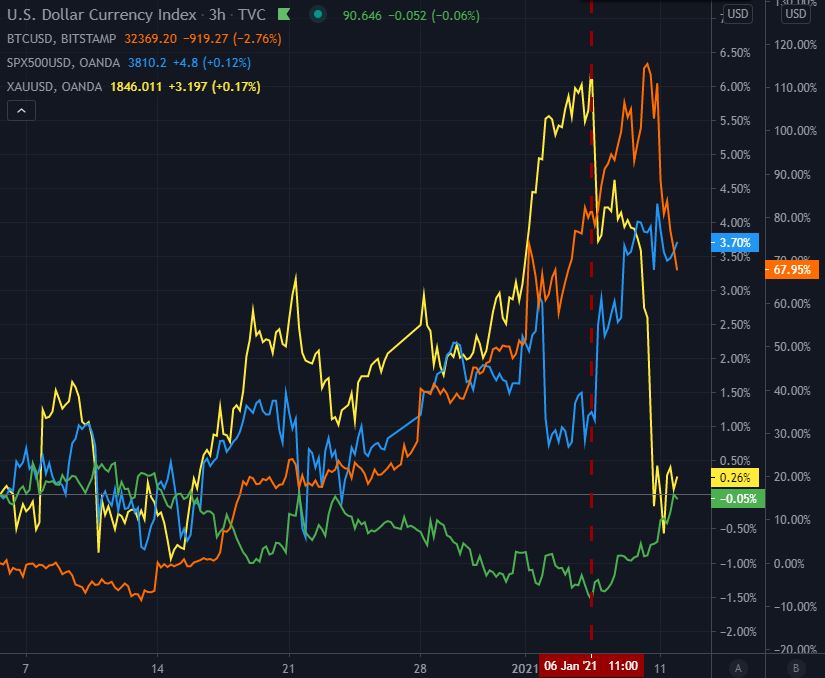
Monkey business abounds, but if we’re really looking for a more cause-and-effect driver to explain today’s pullback, other than the obvious “what goes up must come down” element, it would be today’s uncanny apparent correlation to the U.S. dollar, which bounced hard off her own lows today. Stocks and commodities are also softening on the greenback’s strength.
We did speak a while back about a Dollar Strength risk, and it seems that danger is ever present for all markets. In this chart, we can see the USD Index in green, with the dotted line representing the recent lows of last week and the point that it changed direction.
Gold (yellow line) reacted almost instantly to the change in direction. Bitcoin (orange) reacted with a slight delay, and the S&P 500 is pretending to react, down on the day, but still at the top of its recent range.

The size of the pullback
As of this writing, bitcoin and ether have retraced roughly 28% and 32%, respectively, from their peaks last week, and they are now testing those levels.
People would get really scared, often with some silly headlines in the media about Bitcoin being dead. Once the bottom was in though, we’d see some hard rebounds right back to the top. Those retracements ranged from 20% to even 70% at times, but that was when the market was much younger and less mature.
Today we’ve seen a record breaking figure of $20 billion and counting traded across crypto exchanges. Meanwhile, the number of transactions on the blockchain has seen a rise over the last few weeks but is still not quite at its 2017 peak.
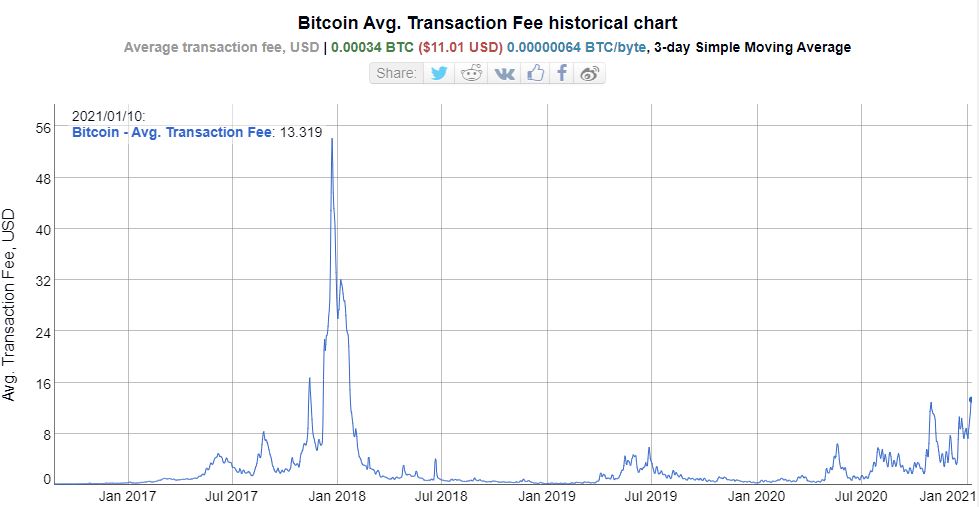
What is interesting is that the average cost to send a bitcoin transaction has gone up in the last few days. At this point, the average blockchain fee for bitcoin is up to $13.32, which is still not at DeFi levels.

It is important to note that the network is seeing a tiny backlog at the moment, but nothing that should in itself be causing the fees to rise.
While there are many potential explanations for this development, it is likely that the aforementioned logjam was caused by bitcoin’s higher price per coin, which in turn makes the fees larger for every transaction.
In any case, those who use the Bitcoin network frequently understand that the value provided will generally be worth the $13, unless you bought in at the top, in which case you may need to wait a bit longer for that value to return.


